One of the simplest and most effective trading strategies in the world, is simply trading price action signals from horizontal levels on a price chart. If you learn only one thing from this site it should be this; look for obvious price action patterns from key horizontal levels in the market. If you just stick to that ‘formula’ you will have plenty of high-probability trading opportunities over the course of one year. Don’t over-complicate the process of analysing the markets / charts and finding trades. The market will generate signals for you when it’s ready, all you need to do is learn what the signals look like and where to look for them at. This is what you will learn in this lesson…
Price action signals + Horizontal levels = Success
It doesn’t really matter which component you find first, the price action signal or the level. What matters is if the two have come together to form a confluent price action trade. When you have an obvious price action signal, like a pin bar or a fakey signal, and that signal has formed at a key horizontal level of support or resistance in a market, you have a potentially very high-probability trade on your hands.
Key horizontal levels of support or resistance are areas or levels on the chart that price made a strong move either up or down from. They can be used in any market condition; trending, counter-trend or trading ranges. The important thing we are focusing on in this lesson is finding a clear price action signal at a key chart level. These levels tend to act like ‘magnets’, attracting price to them before price pushes away again. They can also be thought of as ‘value areas’, or areas on the chart where price found ‘fair value’ which typically happens before a strong move occurs again.
Let’s take a look at some examples of trading price action signals from key chart levels:
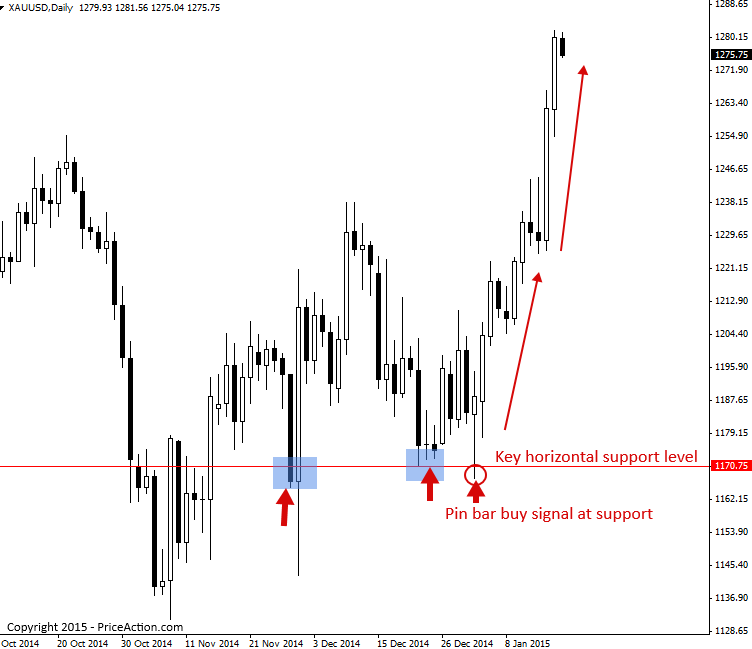
The chart below is a daily Gold chart and it shows us a nice clear example of a well-formed pin bar pattern that formed at a key horizontal level in the market. Clearly, the 1170.00 was already an important horizontal level that you should have had marked on your chart before this pin bar formed. Then, all you needed to do was sit and wait for a signal to form at or near that level. We can see a very nice pin bar buy signal did form at that level, showing a rejection of it that indicated price might push higher in the coming days..
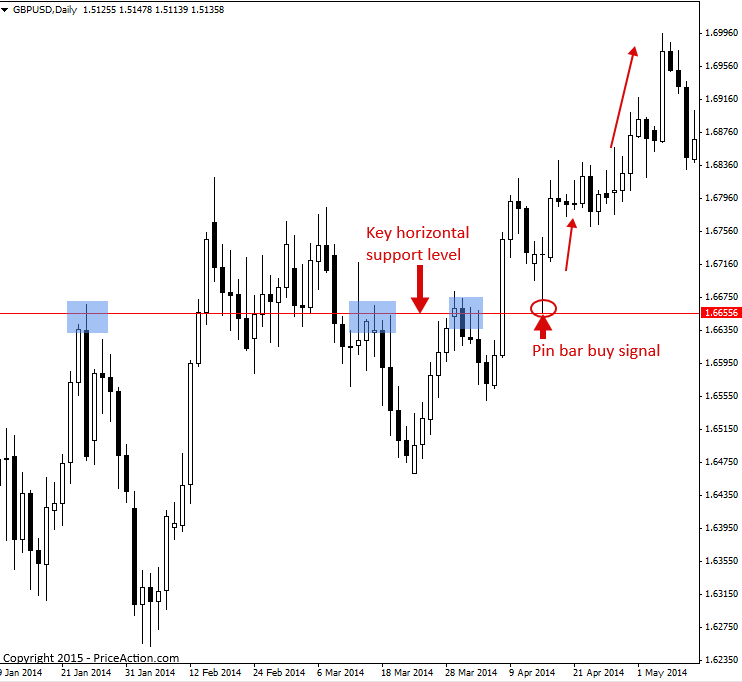
The next example is of a pin bar buy signal that formed at a key chart level of support in an up-trending market. When you get a price action signal that has confluence with a trend and a level, that is a good-quality trade setup. You won’t find a much better example than the one below that formed on the daily GBPUSD chart. We had an uptrend, a key horizontal support level near 1.6655 and then a very well-defined / ‘perfect’ pin bar trading strategy formed at that level. You can see the trend resumed the very next day after that pin bar as price continued pushing higher.
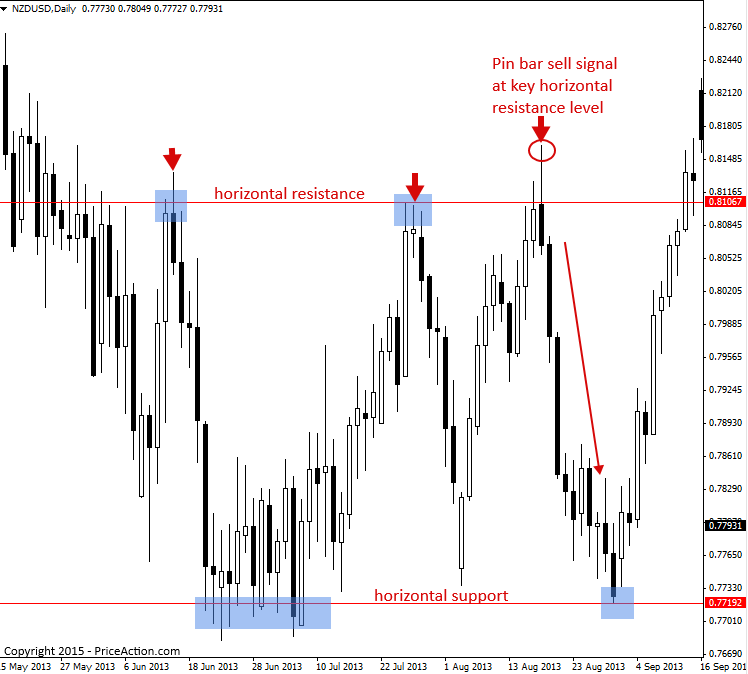
In the chart below, the NZDUSD was trading in a large range, back and forth between horizontal support and resistance levels. In these situations, where a market is range-bound, we can look to the boundaries of the range (support and resistance levels) for potential price action buying or selling opportunities. We can see a fine example of this in the chart below when an obvious pin bar sell signal formed from the horizontal resistance of this trading range, setting off a huge move lower, to the bottom of the range…
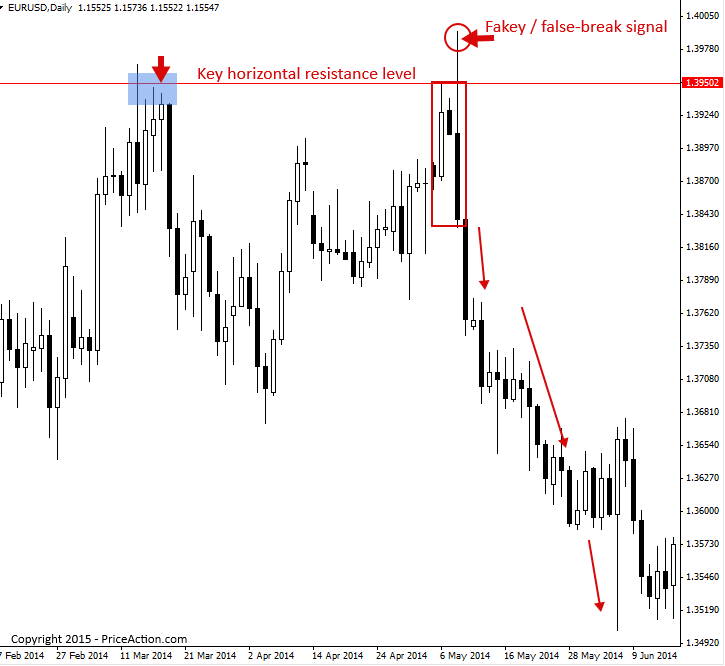
Finally, let’s look at a counter-trend example of trading price action signals at key chart horizontal levels in the market. This is the EURUSD daily chart and we can see a very obvious fakey trading strategy formed at a key resistance level near 1.3950. This fakey signal showed a rejection and false breakout of that level, indicating that the bulls were exhausted and that price may fall lower in the coming days. We can see that price did fall from that fakey signal and it fell significantly lower in the ensuing days. Another clear example of the power of trading price action signals at key horizontal levels in the market.
Conclusion
The main point of this lesson is simply this: You DO NOT NEED a complicated or confusing trading strategy to find high-probability entries in a market. All you need is the ability to recognize price action trading strategies at key chart levels of horizontal support and resistance. If you just focus on this one strategy and really ‘master’ it, you will be able to look at any chart of any market and find high-probability price action trading opportunities.
I hope you’ve enjoyed this lesson on the simplest trading strategy in the world. To learn more, visit the price action trading university.

About Nial Fuller
Nial Fuller is a Professional Trader & Author who is considered ‘The Authority’ on Price Action Trading. He has a monthly readership of 250,000+ traders and has taught over 25,000+ students since 2008. Checkout Nial’s Price Action Trading Course here.
Leave a Reply